XRP faced intense selling pressure at key support levels before a dramatic V-shaped reversal with high volume signaled potential exhaustion of downward momentum.
News background
The decline played out against a background of mixed institutional signals and increased macro uncertainty. Crypto markets remain trapped in a medium-term downtrend, with sentiment anchored in fear zone, as volatility rises across large companies.
Canary Capital’s recently launched US spot XRP ETF (XRPC) recorded $58.6 million in first-day volume, far exceeding analysts’ expectations of $17 million. Still, the strong debut failed to stabilize XRP as derivatives markets flashed signs of stress. Roughly $28 million in XRP liquidations hit within 24 hours, with long positions accounting for nearly $25 million of the wipeout.
Market analysts warn that institutional flows remain conflicted – ETF inflows are showing interest, but broader risk-off pressures continue to suppress crypto liquidity and momentum.
Price action summary
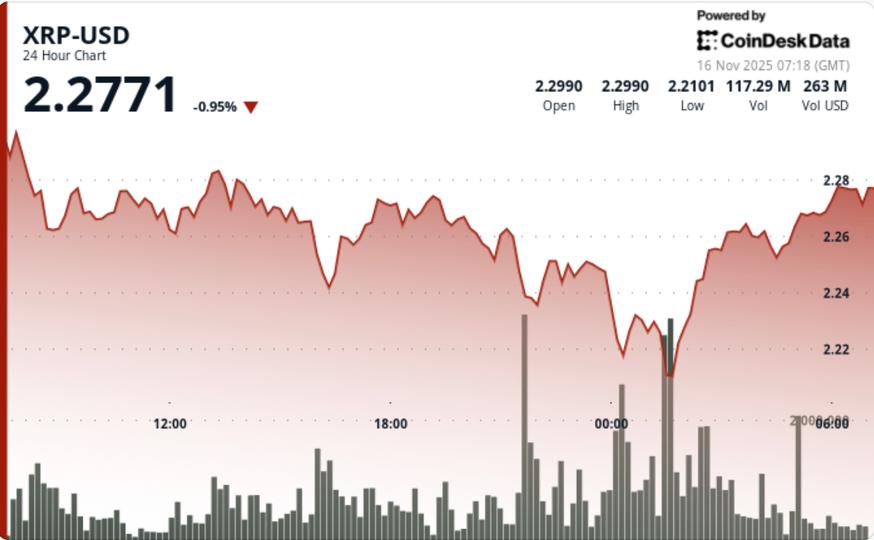
XRP fell 4.3% from $2.31 to $2.22 during the 24-hour session ending November 16 at 02:00 UTC. The drop cut a $0.10 range with a clear sequence of lower highs confirming bearish structure.
The most aggressive selling hit at 00:00 UTC when 74M XRP traded – 69% above the 24-hour average – breaking support at $2.24. The price fell to $2.22, marking the session low. Three separate volume spikes above 57M during decline phases validated sustained distribution.
Despite the ETF catalyst, selling accelerated as price rejected $2.31 and did not find support near previous consolidation zones. The pair fell to a tight $2.22-$2.23 consolidation after the breakdown.
Technical Analysis
Support/Resistance:
- Primary support: $2.22 (low surrender)
- Immediate resistance: $2.23-$2.24 breakdown zone
- Critical Fibonacci support: $2.16 (0.382 retracement) – loss of this level risks a rapid decline towards $2.02-$1.88
Volume profile:
- Breakdown volume: 74M XRP (+69%) confirms capitulation
- Two reversal phase peaks (01:39, 01:46): 4.7 million each, signaling selling exhaustion
- The recovery saw normalized but stable volume, consistent with bottom fishing
Chart structure:
- Overnight price hammered in support, printing a textbook V-shaped reversal
- Higher lows formed at $2,209 → $2,217 → $2,227 indicating momentum shift
- However, a broader downtrend from $2.31 remains intact pending resistance requirements
- Failure to break $2.23-$2.24 zone limits upside follow-up
Momentum indicators:
- Intraday oversold conditions triggered the reversal, but the daily trend bias remains bearish
- The 50D/200D structure slopes downwards, increasing overhead pressure
What traders should know
XRP sits on a tactical pivot after a dramatic washout:
- Holding $2.22 is crucial – failure reveals direct move towards $2.16, then $2.02-$1.88
- A confirmed claim of $2.24 followed by $2.31 is needed to rebuild bullish structure
- ETF flows will affect volatility — follow early XRPC volume in US market open
- The V-shaped rebound provides short-term relief, but greater resistance overhead limits the immediate upside
- A sustained break above $2.48 is required to move the trend bias back towards the $2.60+ target


