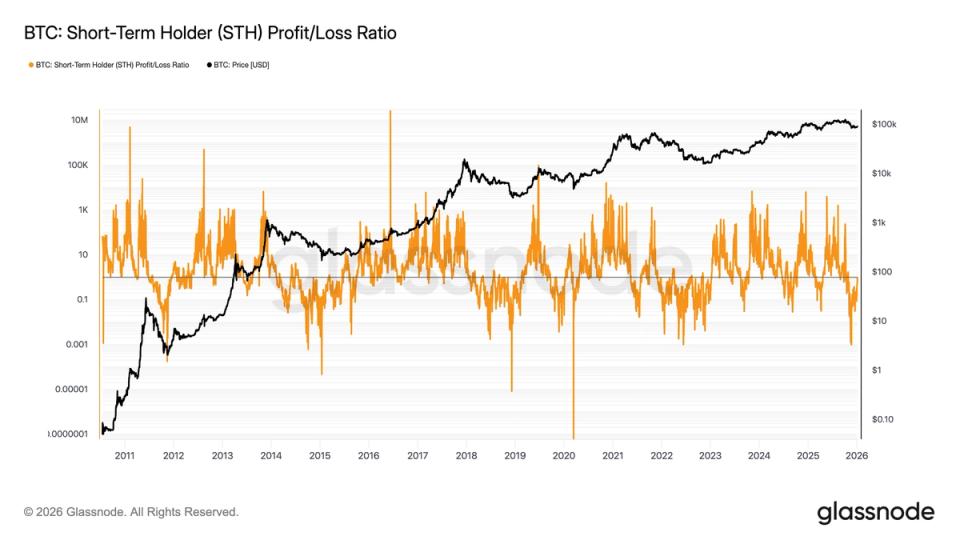
Like bitcoin fell in late November to nearly $80,000, the ratio of short-term holder supply in profit to short-term holder supply in loss fell to levels that have historically coincided with major or local bear market bottoms.
On November 24, the ratio fell to 0.013. Every previous instance of the ratio reaching this level has marked either a local bottom or the final bear market low, including in 2011, 2015, 2018 and 2022, according to Glassnode data.
Glassnode defines short-term holders as investors who have held bitcoin for less than 155 days. At the November low, the seven-day moving average of short-term holder supply in profit fell to approximately 30,000 BTC. In contrast, short-term holder supply rose in losses to 2.45 million BTC, the highest level since the November 2022 FTX collapse, when bitcoin bottomed out near $15,000.
Since the start of 2026, bitcoin has risen to around $94,000, a jump of over 7%. During this period, short-term holder supply in loss has fallen to 1.9 million BTC, while short-term holder supply in profit has increased sharply to 850,000 BTC – a ratio of about 0.45.
Historically, as the ratio approaches 1, it tends to move above it and continue to expand beyond it. The price of bitcoin tends to enter a sustained upside phase at the same time. With the ratio currently below 0.5%, the metric suggests there is still room for significant further expansion before reaching equilibrium.
As for peaks, they have tended not to occur until the ratio rises towards 100.


