The two things most cryptocurrency investors consider is how much lower can bitcoin go go and how much longer this bear market could last.
The price pain aspect has been widely discussed, but the time-based dimension is another question in itself.
Price pain refers to sharp moves or volatility that force participants out of positions, while time pain reflects slow, range-bound conditions that exhaust both bulls and bears through lack of direction.
Bitcoin is currently trading below $66,000, down more than 3% in the past 24 hours and about 45% below its October peak, a nearly six-month bear market.
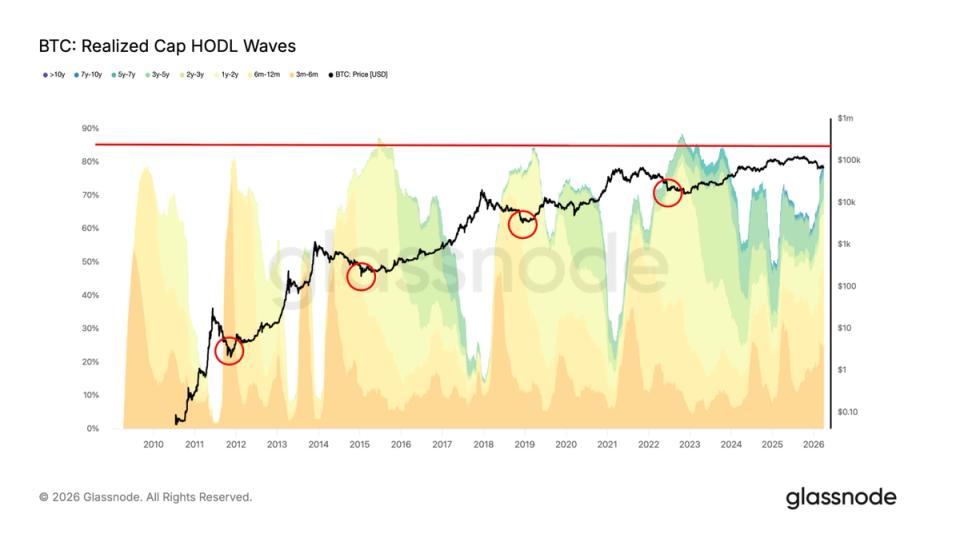
An indicator that points towards persistent time pain is the Realized Cap HODL Waves from Glassnode. This metric groups the bitcoin supply by the last time coins moved, with each band representing different holding periods, and weights them by the realized price, the average price at which coins last traded on the chain.
Historically, bear market bottoms have coincided with long-term owners, those who hold for six months or more and control at least 85% of the supply. Typically, price bottoms form first and only several months later does long-term holder supply approach these high levels, indicating that these investors bought at low prices and held through the bear market.
Currently, long-term owners account for around 80% of the supply. If this trend continues, the market could be nearing a bottom, although several months of consolidation are likely still ahead.


