Bitcoin may have recently seen a dip below $70,000, but a ton of BTC was traded then, in a sign of a strong dip in demand.
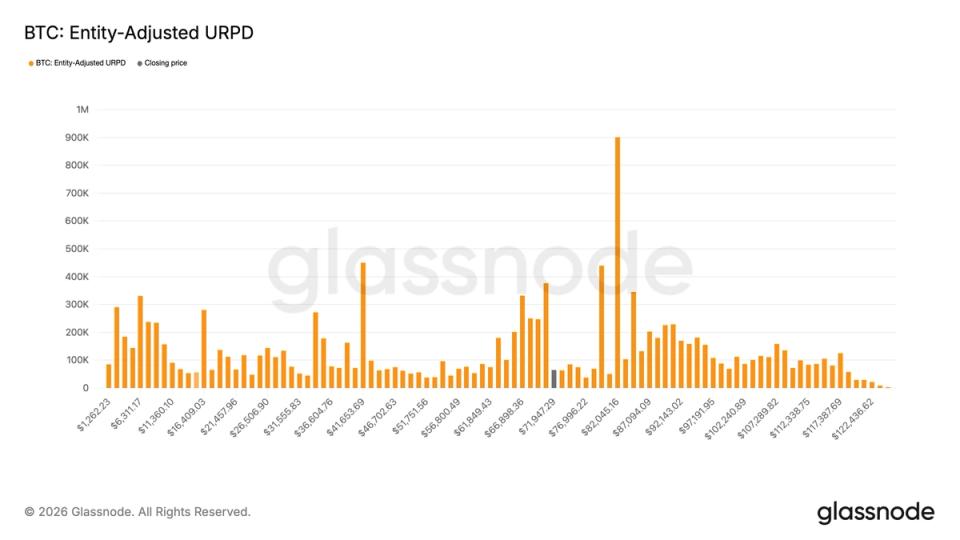
That’s according to blockchain data, which shows that the total amount of BTC that last moved on-chain in the $60,000-$70,000 range now stands at 1,845,766 BTC, up from 1,001,491 BTC on January 1, according to data source Glassnode. This increase of 844,275 BTC indicates that some market participants aggressively bought the dip below $70,000.
More importantly, the 1.84 million BTC figure accounts for about 9.23% of bitcoin’s circulating supply. This means that valuations below $70,000 can act as a floor because a lot of coins are “anchored” there and sellers may be reluctant to sell below that.
These numbers are derived from Glassnode’s Realized Price Distribution (URPD) metric, which shows the price levels at which the current set of bitcoin UTXOs—basically, individual chunks of bitcoin in wallets—last moved. Each bar, as seen in the feature image, represents how much bitcoin is held at a given price. This version is unit-adjusted, meaning that coins owned by the same owner are grouped together based on the average price at which they were acquired.
While the $60,000 to $70,000 range has seen a lot of activity, the $70,000 to $80,000 range looks relatively thin, according to Glassnode. Only 400,000 BTC sits in this range, which is almost half of the amount traded below $70,000.
Bitcoin has surged back above $70,000 following the temporary ceasefire between the US and Iran. The cryptocurrency spent the better part of the last five weeks or so trading back and forth below $70,000. Still, it remained resilient against traditional risk assets such as stocks, which wilted as the Iran war lifted oil prices per barrel. barrel above $100.


