Heavy selling pressure drives XRP 2% lower before stabilizing near key support. Institutional positioning and fresh open interest suggest accumulation at current levels.
News background
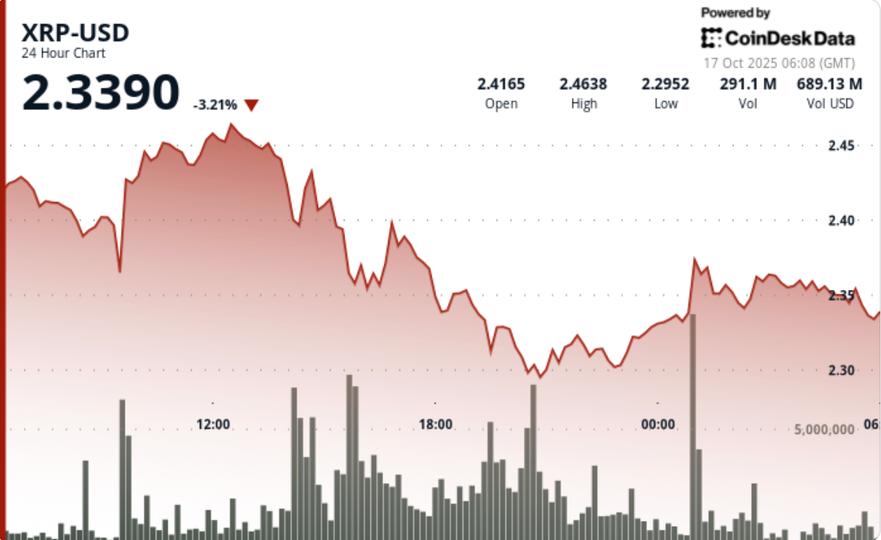
- XRP extended its decline through the 16-17 session. October, falling 2% from $2.41 to $2.36 amid the ongoing institutional liquidation. Market data shows more than 150 million in daily volume as long-term holders trimmed positions by 34% over the past two weeks.
- The Hodler Net Position Change metric fell from 163.7 million. to 107.8 million tokens – a clear sign of sell-off rotation after the mid-month spike in volatility.
- Despite the pullback, open interest rose to $1.36bn as derivatives traders began to rebuild exposure after the weekend washout.
- The market desk says the renewed activity could mark the start of tactical long positioning amid quarter-end ETF speculation and macro-relaxing signals.
Summary of price action
- XRP traded between $2.31 and $2.47 over the 24-hour window, a band of $0.16 representing 7% intraday volatility.
- Selling intensified from 14:00-20:00 as the price fell 8% intraday from $2.44 to $2.29 before recovering modestly to close in the US.
- Reversals in large volumes above $2.31 confirmed strong spot demand and algorithmic buying on weakness.
- Resistance remains capped near $2.47, where repeated rejection wicks signal ongoing supply pressure.
- The last hour (04:34-05:33) showed $2.35-$2.36 consolidation with 1.6 million. in volume peaks – typical for controlled re-accumulation phases after forced liquidations.
Technical Analysis
- XRP’s price structure is stabilizing inside the $2.31-$2.47 channel, with the $2.35 pivot acting as a short-term anchor. Volume clusters around this zone indicate institutional accumulation despite the broader risk-off tone.
- A clean claim at $2.47 would invalidate the short bearish setup and open a path towards $2.55.
- Momentum indicators remain neutral to oversold, while funding rates turned slightly positive – a sign that short coverage has eased. Analysts expect continued choppy consolidation until macro risk abates or ETF-related flows accelerate.
What Traders See
- $2.31–$2.35 support zone – base defense levels signaling buyer absorption.
- $2.47 Resistance Recovery — First Confirmation Trigger for Reversal Momentum.
- Open interest and funding normalization — evidence of post-flush re-leveraging.
- ETF Timeline and Fed Comments as Catalysts for Q4 Cryptoflow Rotation.


