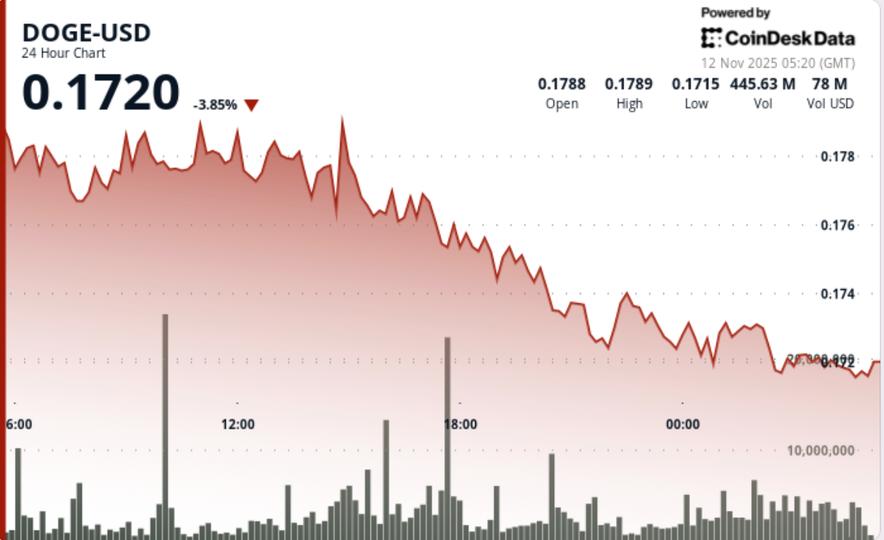
The memecoin broke below the critical $0.1720 level on heavy volume as sellers dominated the US session and tested the resilience of long-term technical support.
News background
- Dogecoin extended its decline on Tuesday, tumbling 5.5% from $0.1831 to $0.1730 as bearish momentum accelerated across European trading hours.
- The sharp move unfolded within a $0.0121 range as price action confirmed a textbook lower-high, lower-low formation.
- Heavy selling occurred at the $0.1789 resistance zone, triggering a cascade through successive support levels until buyers stabilized the move near $0.1719.
Summary of price action
- DOGE’s session structure reflects deteriorating momentum with declining support strength.
- The failure to regain $0.1789 resistance validates a short-term bearish trend, while compression around $0.1730 highlights uncertainty among short-term traders.
- The $0.1719 zone absorbed several retests and formed a fragile base that may define the next pivot point for directional traders.
- Declining volume from highs suggests temporary seller exhaustion, but without subsequent buying, the market remains vulnerable to another downside test.
Technical Analysis
- Without major fundamental triggers, price action remains purely technical.
- DOGE’s break below its short-term moving average reinforces the broader bearish bias that has persisted since early November. The hourly RSI is near 38, indicating mildly oversold conditions, but not yet capitulation.
- Market analyst Kevin (@Kev_Capital_TA) highlights the weekly 200 EMA near $0.16 as Dogecoin’s structural “line in the sand.”
- That level has held through six previous retests since the summer, marking the boundary between cyclical pullback and long-term trend reversal.
What traders should know
- The immediate focus is whether the $0.17 handle can hold under continued pressure. Institutional order flow metrics suggest systematic risk reduction rather than panic liquidation – leaving room for a technical rebound if volume slows further.
- Failure of the $0.1720-$0.1719 support cluster could reveal the $0.1650-$0.1600 zone where the weekly moving average sits as the last structural support.


