XRP pulls back from intraday highs amid heavier trading activity, holding above key support levels while lagging broader crypto benchmarks.
News background
- XRP fell 1.17% to $2.39 during Tuesday’s session, underperforming the CD5 index by 1.47 percentage points as sellers regained control in the short term.
- The move came despite a 5.77% increase in trading activity above weekly averages, signaling tactical repositioning rather than outright liquidation.
Price action remained contained within the $2.33-$2.44 corridor and maintained technical integrity even as market flows shifted. - Traders described the move as “order book departure” – heavy rotation within a defined area – with institutions recalibrating ahead of potential catalysts.
Summary of price action
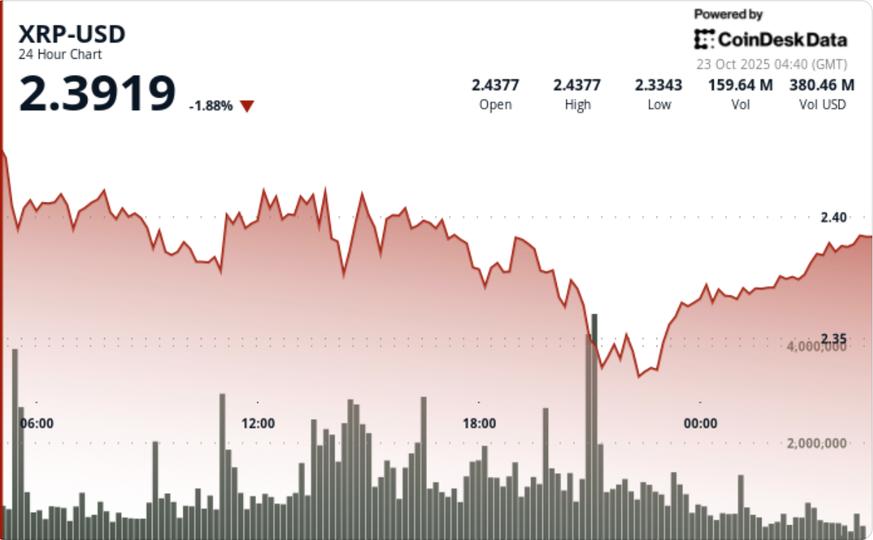
- XRP fell from $2.44 to $2.39 through Tuesday’s session, carving out a descending channel that defined a 4.2% volatility range.
- The steepest drop occurred around 9:00 p.m., where volume rose to 111.3 million — 83% above the 24-hour average — as bears drove the price through $2.36 support to a session low of $2.33.
- Buyers resurfaced around the psychological $2.33 level, sparking a modest rally to $2.39 on lighter volume. Resistance strengthened near $2.41, with repeated rejections forming a lower-high structure into the close.
- The contained recovery suggests positioning rather than directional conviction, with market makers managing inventory amid low conviction flows.
Technical Analysis
- XRP’s structure remains range-bound with a descending channel forming between $2.44 resistance and $2.33 support.
- The token’s inability to break above $2.41 reflects short-term exhaustion, although a sustained defense at $2.33 signals a strong bid depth.
- Momentum indicators are hovering near neutral levels and volume remains elevated enough to sustain interest but below breakout thresholds. Hourly data shows XRP stabilizing above $2.38 midrange support while maintaining a narrowing volatility band – a typical pre-break compression setup.
What Traders See
- Traders are focused on whether volume re-acceleration confirms continued pressure or precedes a mean reversion push above $2.41.
- A daily close above that resistance could trigger momentum extension towards $2.47-$2.50, while a sustained break below $2.33 risks a return to the $2.28 zone.
- Institutional desks are also keeping an eye on macro correlations — notably gold’s reversal lower and bitcoin’s steady bid — to gauge the rotational dynamics across risk assets as volatility compresses.


