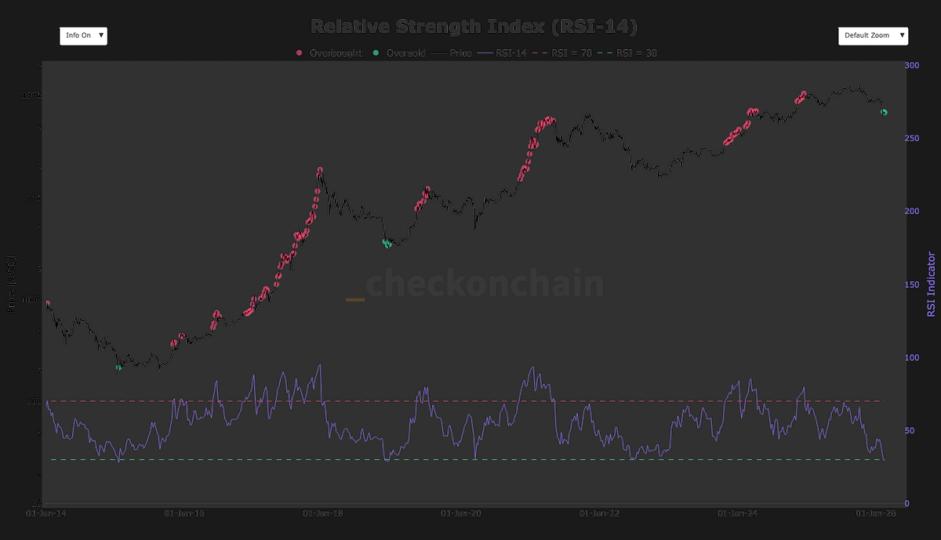
Bitcoin’s 14-day Relative Strength Index (RSI) fell below 30 for only the third time in its history this month, according to checkonchain.
The RSI is a popular tool for detecting an asset’s momentum by measuring the speed and magnitude of recent price movements and comparing average gains and losses over a set 14-day period.
The index gives a reading between 0 and 100, with levels above 100 generally considered overbought, while readings below 30 indicate oversold conditions, suggesting that selling may be overextended. Bitcoin’s 14-day RSI has not hit 100 since December 2024, when bitcoin first surpassed $100,000.
Previous readings below 30 marked previous cycle bottoms. In January 2015, bitcoin’s RSI dropped to around 28 as the price hovered close to $200. The market then spent about eight months consolidating before a sustained recovery began. A similar pattern emerged in December 2018 when the RSI dropped below 30 around $3,500. That period was followed by about three months of sideways accumulation before bitcoin broke higher.
BTC is trading around $66,000, with sentiment stuck in “fear” or “extreme fear” on the Crypto Fear & Greed Index for much of the past 30 days. Since peaking in October, bitcoin has fallen more than 50%, briefly dipping towards $60,000.
History suggests that the current move could lead to consolidation around the $60,000 region in the coming months before the next leg up.


