Many traders watched the bitcoin (BTC) price action during European hours on Friday a little confused, and with good reason.
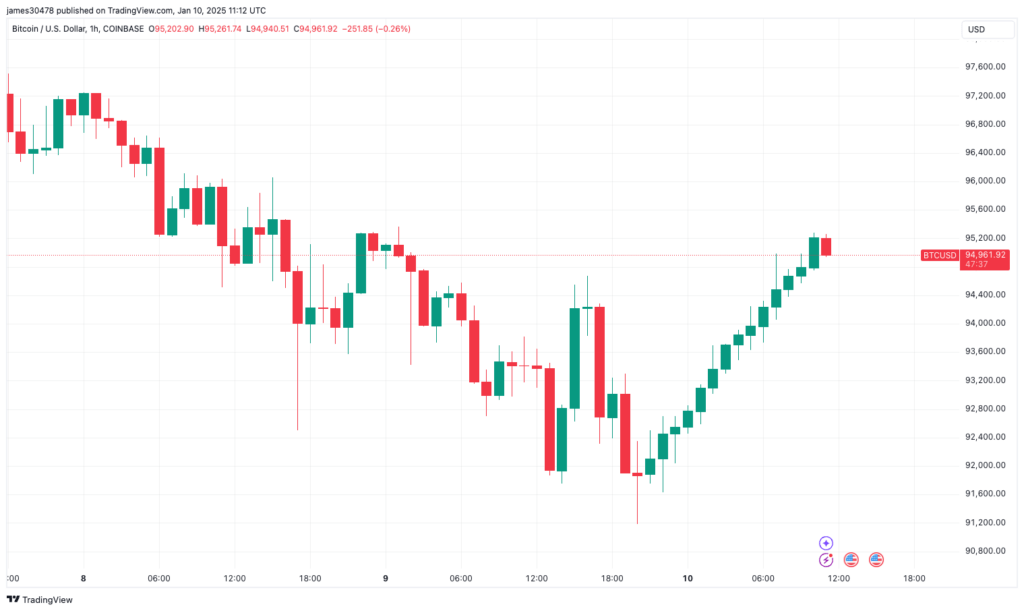
If you look at the BTCUSD pair candlestick chart on Coinbase, you will see fourteen green hourly candles, which means that for the last 14 hours, bitcoin has made gains every hour.
The hourly candles come as the BTC price has risen from $91,771 to $95,283. The trend started on January 9 at 21.00 UTC and has worked its way up to 10:00 UTC on January 10.
The unusual price chart has left traders on X confused.
Vetle Lunde, senior analyst at K33 Research, compiled data points for when this last happened. This is currently the longest hour for green candles since at least January 1, 2017, when it set 11.
But this isn’t the first time we’ve seen double-digit hourly green candles in recent times. Bitcoin charts have also shown similar patterns on January 14, 2023 (11), February 26, 2024 (11), and November 12, 2024 (11).
The fifteenth hour candle is currently red, potentially stopping this trend and should end at 12:00 UTC.


