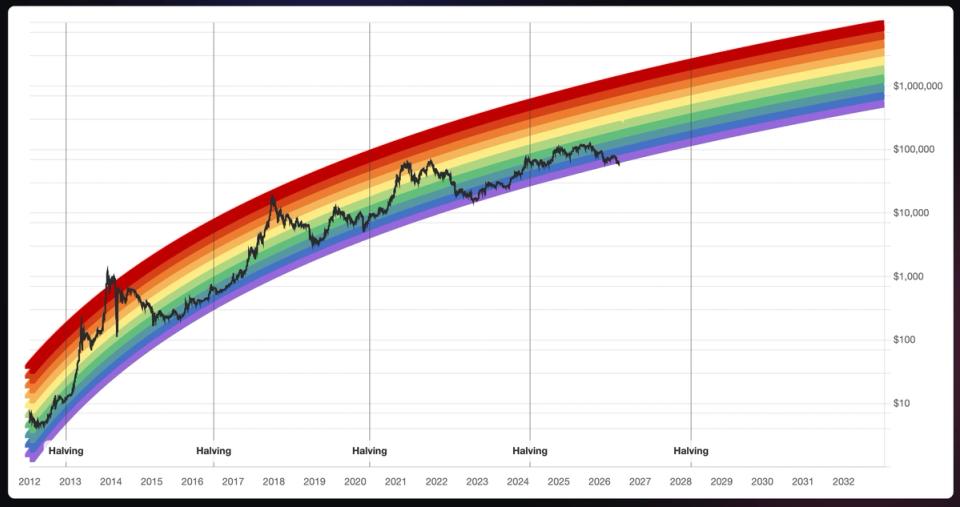
Bitcoin peaked at $126,000 in October without reaching the Rainbow Chart’s upper red band. Now, with BTC close to $62,500, the price has fallen below the bottom of the chart.
The deviation comes as other widely followed bitcoin valuation models have also struggled. The Stock-to-Flow model, which links bitcoin’s price to its programmed supply reductions, predicted significantly higher prices after the halving in 2024 than bitcoin ultimately achieved.
Mark Zalan, CEO of GoMining, agreed that the bottom band does not indicate a permanent collapse.
Bitcoin dead zone
The “Bitcoin is dead” zone does not mean that Bitcoin is actually dead,” Zalan told CoinDesk. “Historically, it has often marked periods of extreme fear and undervaluation, which were later followed by recovery. It signals emotion more than certainty.”
Zalan said the chart remains useful but “less accurate than it once was.”
“The 2025 cycle showed that BTC does not have to follow old patterns exactly,” Zalan said. “ETFs, institutions and changing market structure have changed the game.”
Bitcoin is trading close to its April 2024 halving price, a development that runs counter to expectations for the current four-year cycle.
Levin said the chart confirms what “the cycle data has shown us, the exponential growth assumptions built into this chart were calibrated to a retail-driven, illiquid asset, not a $1.25 trillion market with ETF flows and institutional balance sheets setting the marginal price.”


