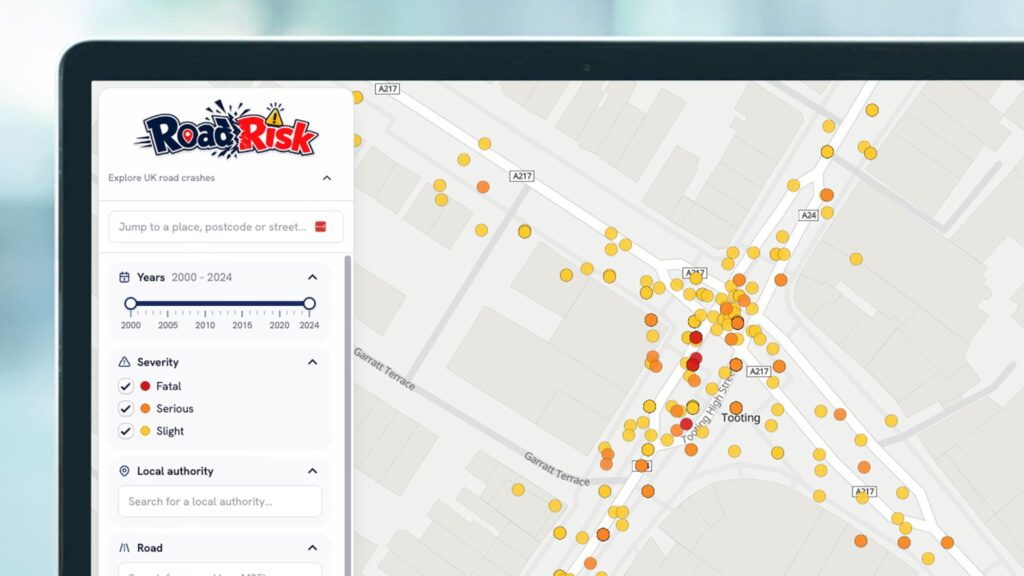
- The site maps open source accident data on an interactive map
Cyclists, pedestrians and cautious drivers can find the data offered by interactive online map service RoadRisk invaluable when trying to plan the safest routes to get from A to B.
The online tool, which uses OpenStreetMap at its core and STATS19 accident reports from police forces in England, Scotland or Wales, plots all collision data from the years 2000 to 2025 on an easy-to-navigate map.
Simply punch in a postcode and the website will reveal all the accident data from around 350 local authorities over the past 25 years, each colour-coded based on the severity of the collision: minor, serious and fatal.

The STATS19 data does not contain names, addresses, telephone numbers or vehicle registration details, with only age, gender and a deprivation score at the area level.
Interestingly, the site’s homepage also lists the worst roads for fatalities (that would be the A38) and the worst local authority for collisions, which is Birmingham.
RoadRisk says the UK Department for Transport typically publishes each year’s accident data around September of the following year, with the maps updated shortly after each release.
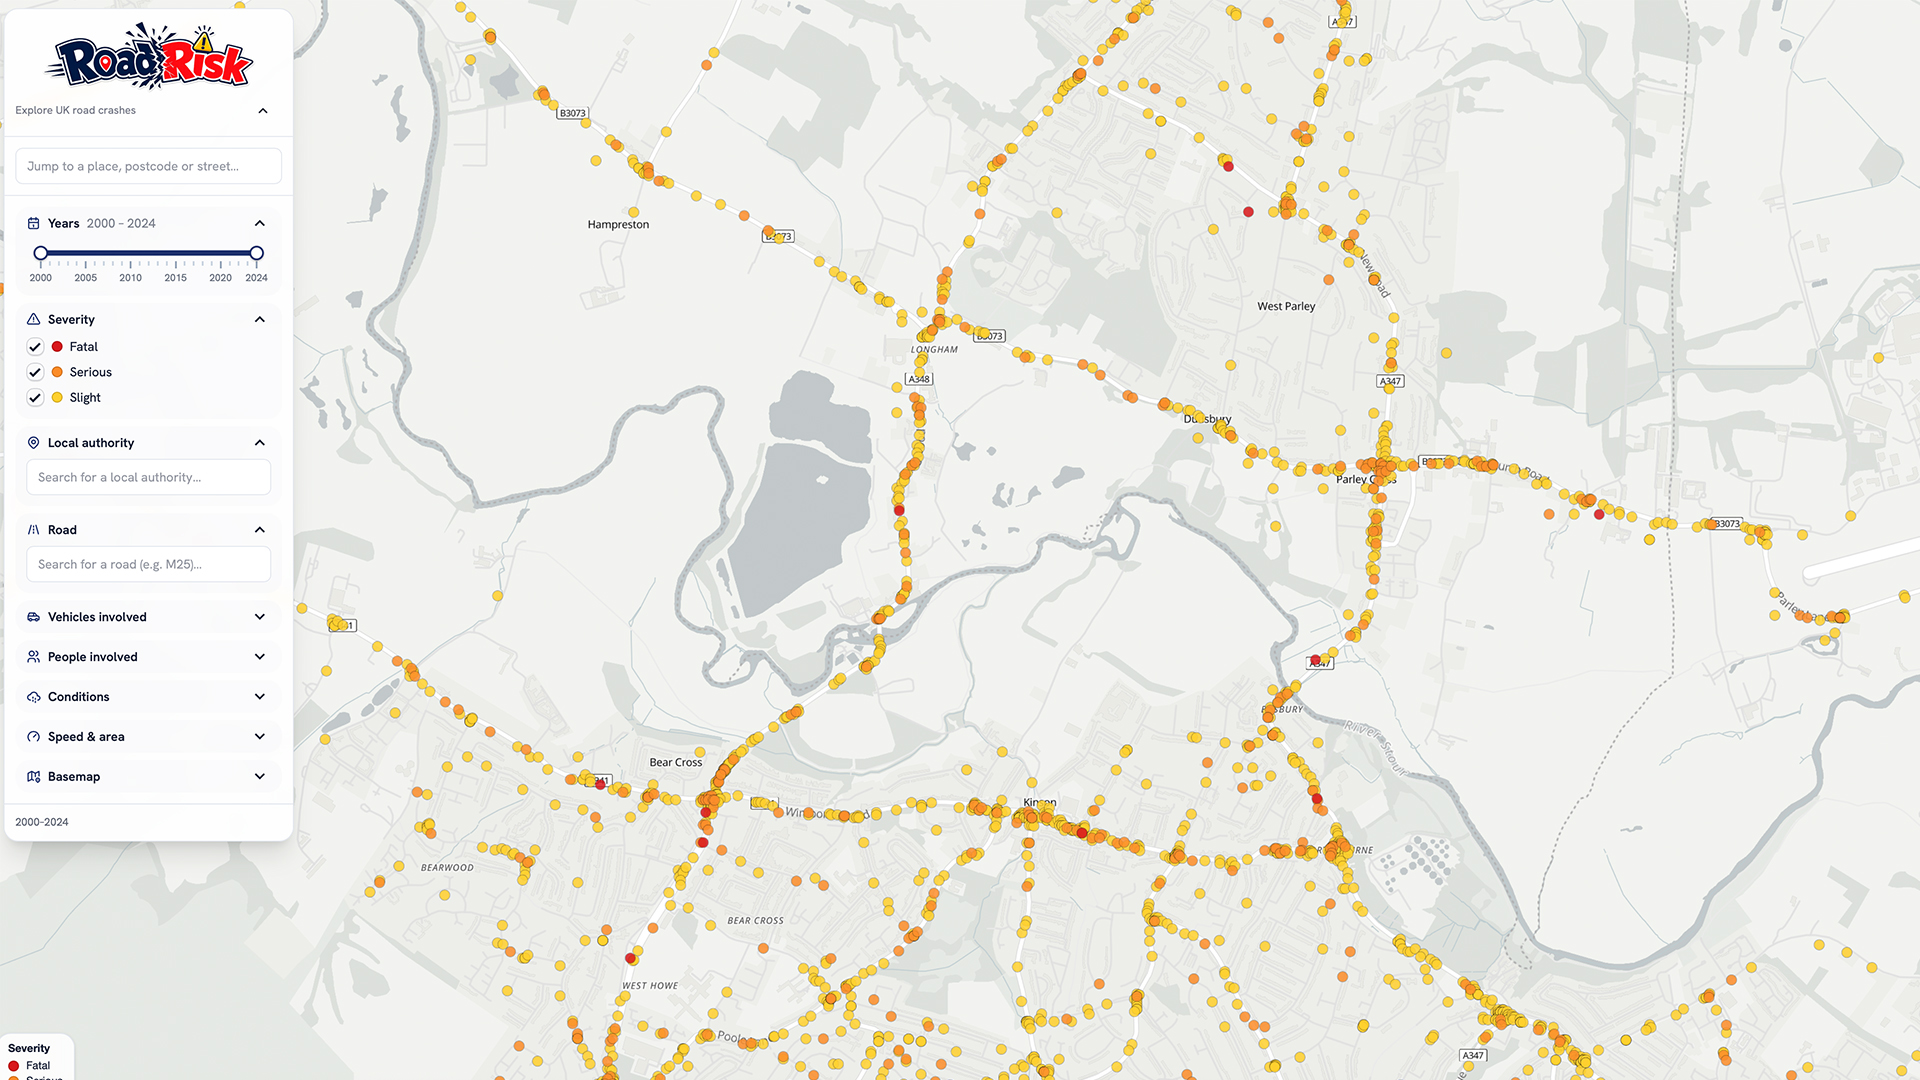
These shocking results supported my decision to walk them over some of the most dangerous routes before waving them off in the morning.
Likewise, there are a number of roads in my local area that appear to be hotspots for collisions with cyclists, which could well inform the next route I take into town.
What’s more, RoadRisk says anyone can use the data to cite statistics, take screenshots and use the information for any purpose – a boon for anyone lobbying the local authority for safer roads.

Follow TechRadar on Google News and add us as a preferred source to get our expert news, reviews and opinions in your feeds.